


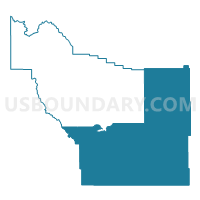
Census Tract 3, Fremont County, Wyoming
About
Outline

Summary
| Unique Area Identifier | 504630 |
| Name | Census Tract 3 |
| County | Fremont County |
| State | Wyoming |
| Area (square miles) | 4,767.09 |
| Land Area (square miles) | 4,752.60 |
| Water Area (square miles) | 14.49 |
| % of Land Area | 99.70 |
| % of Water Area | 0.30 |
| Latitude of the Internal Point | 42.72487550 |
| Longtitude of the Internal Point | -108.17391660 |
| Total Population | 4,422 |
| Total Housing Units | 2,461 |
| Total Households | 1,922 |
| Median Age | 47.9 |
Maps

Graphs
Select a template below for downloading or customizing gragh for Census Tract 3, Fremont County, Wyoming


Neighbors
Neighoring Census Tract (by Name) Neighboring Census Tract on the Map
- Census Tract 1, Fremont County, WY
- Census Tract 1.02, Sublette County, WY
- Census Tract 18, Natrona County, WY
- Census Tract 2, Washakie County, WY
- Census Tract 2, Fremont County, WY
- Census Tract 9401, Fremont County, WY
- Census Tract 9402.01, Fremont County, WY
- Census Tract 9402.02, Fremont County, WY
- Census Tract 9676, Carbon County, WY
- Census Tract 9679, Hot Springs County, WY
- Census Tract 9716, Sweetwater County, WY
Top 10 Neighboring County Subdivision (by Population) Neighboring County Subdivision on the Map
- Rock Springs North CCD, Sweetwater County, WY (28,199)
- Wind River CCD, Fremont County, WY (26,330)
- Rawlins CCD, Carbon County, WY (11,065)
- Lander CCD, Fremont County, WY (11,019)
- Hells Half Acre CCD, Natrona County, WY (6,942)
- Shoshoni CCD, Fremont County, WY (827)
- Ten Sleep CCD, Washakie County, WY (730)
- Wamsutter CCD, Sweetwater County, WY (631)
- Thermopolis East CCD, Hot Springs County, WY (517)
- Boulder CCD, Sublette County, WY (401)
Top 10 Neighboring Place (by Population) Neighboring Place on the Map
- Lander city, WY (7,487)
- Shoshoni town, WY (649)
- Hudson town, WY (458)
- Boulder Flats CDP, WY (408)
- Jeffrey City CDP, WY (58)
- Atlantic City CDP, WY (37)
Top 10 Neighboring Unified School District (by Population) Neighboring Unified School District on the Map
- Natrona County School District 1, WY (75,450)
- Sweetwater County School District 1, WY (30,043)
- Fremont County School District 25, WY (16,987)
- Fremont County School District 1, WY (11,330)
- Carbon County School District 1, WY (11,195)
- Sublette County School District 1, WY (6,932)
- Hot Springs County School District 1, WY (4,812)
- Fremont County School District 14, WY (2,344)
- Fremont County School District 21, WY (2,190)
- Fremont County School District 38, WY (1,631)
Top 10 Neighboring State Legislative District Lower Chamber (by Population) Neighboring State Legislative District Lower Chamber on the Map
- State House District 22, WY (12,218)
- State House District 33, WY (9,942)
- State House District 38, WY (9,702)
- State House District 54, WY (9,560)
- State House District 17, WY (9,400)
- State House District 34, WY (9,254)
- State House District 27, WY (8,533)
- State House District 48, WY (8,185)
- State House District 28, WY (7,894)
- State House District 47, WY (7,767)
Top 10 Neighboring State Legislative District Upper Chamber (by Population) Neighboring State Legislative District Upper Chamber on the Map
- State Senate District 16, WY (23,184)
- State Senate District 30, WY (20,562)
- State Senate District 25, WY (19,502)
- State Senate District 26, WY (18,754)
- State Senate District 12, WY (17,585)
- State Senate District 20, WY (16,427)
- State Senate District 11, WY (16,180)
Top 10 Neighboring 111th Congressional District (by Population) Neighboring 111th Congressional District on the Map
Top 10 Neighboring 5-Digit ZIP Code Tabulation Area (by Population) Neighboring 5-Digit ZIP Code Tabulation Area on the Map
- 82604, WY (25,882)
- 82501, WY (19,408)
- 82520, WY (13,535)
- 82301, WY (9,584)
- 82443, WY (4,697)
- 82514, WY (1,645)
- 82649, WY (1,120)
- 82932, WY (836)
- 82923, WY (558)
- 82515, WY (446)
Data
Demographic, Population, Households, and Housing Units
** Data sources from census 2010 **
Show Data on Map
Download Full List as CSV
Download Quick Sheet as CSV
| Subject | This Area | Fremont County | Wyoming | National |
|---|---|---|---|---|
| POPULATION | ||||
| Total Population Map | 4,422 | 40,123 | 563,626 | 308,745,538 |
| POPULATION, HISPANIC OR LATINO ORIGIN | ||||
| Not Hispanic or Latino Map | 4,256 | 37,859 | 513,395 | 258,267,944 |
| Hispanic or Latino Map | 166 | 2,264 | 50,231 | 50,477,594 |
| POPULATION, RACE | ||||
| White alone Map | 4,107 | 29,813 | 511,279 | 223,553,265 |
| Black or African American alone Map | 11 | 101 | 4,748 | 38,929,319 |
| American Indian and Alaska Native alone Map | 150 | 8,498 | 13,336 | 2,932,248 |
| Asian alone Map | 28 | 157 | 4,426 | 14,674,252 |
| Native Hawaiian and Other Pacific Islander alone Map | 0 | 10 | 427 | 540,013 |
| Some Other Race alone Map | 22 | 412 | 17,049 | 19,107,368 |
| Two or More Races Map | 104 | 1,132 | 12,361 | 9,009,073 |
| POPULATION, SEX | ||||
| Male Map | 2,230 | 20,030 | 287,437 | 151,781,326 |
| Female Map | 2,192 | 20,093 | 276,189 | 156,964,212 |
| POPULATION, AGE (18 YEARS) | ||||
| 18 years and over Map | 3,530 | 29,911 | 428,224 | 234,564,071 |
| Under 18 years | 892 | 10,212 | 135,402 | 74,181,467 |
| POPULATION, AGE | ||||
| Under 5 years | 234 | 3,145 | 40,203 | 20,201,362 |
| 5 to 9 years | 242 | 2,845 | 37,213 | 20,348,657 |
| 10 to 14 years | 252 | 2,617 | 35,955 | 20,677,194 |
| 15 to 17 years | 164 | 1,605 | 22,031 | 12,954,254 |
| 18 and 19 years | 75 | 1,075 | 16,111 | 9,086,089 |
| 20 years | 31 | 522 | 8,377 | 4,519,129 |
| 21 years | 35 | 511 | 7,974 | 4,354,294 |
| 22 to 24 years | 87 | 1,410 | 23,967 | 12,712,576 |
| 25 to 29 years | 202 | 2,581 | 41,276 | 21,101,849 |
| 30 to 34 years | 222 | 2,258 | 36,373 | 19,962,099 |
| 35 to 39 years | 212 | 2,175 | 33,861 | 20,179,642 |
| 40 to 44 years | 285 | 2,325 | 33,105 | 20,890,964 |
| 45 to 49 years | 325 | 2,697 | 39,472 | 22,708,591 |
| 50 to 54 years | 417 | 3,056 | 44,105 | 22,298,125 |
| 55 to 59 years | 444 | 3,035 | 40,946 | 19,664,805 |
| 60 and 61 years | 162 | 1,036 | 14,123 | 7,113,727 |
| 62 to 64 years | 202 | 1,425 | 18,444 | 9,704,197 |
| 65 and 66 years | 112 | 804 | 10,034 | 5,319,902 |
| 67 to 69 years | 159 | 1,044 | 12,940 | 7,115,361 |
| 70 to 74 years | 191 | 1,405 | 16,594 | 9,278,166 |
| 75 to 79 years | 145 | 1,081 | 12,492 | 7,317,795 |
| 80 to 84 years | 108 | 808 | 9,428 | 5,743,327 |
| 85 years and over | 116 | 663 | 8,602 | 5,493,433 |
| MEDIAN AGE BY SEX | ||||
| Both sexes Map | 47.90 | 38.50 | 36.80 | 37.20 |
| Male Map | 46.90 | 37.50 | 36.00 | 35.80 |
| Female Map | 49.00 | 39.50 | 37.70 | 38.50 |
| HOUSEHOLDS | ||||
| Total Households Map | 1,922 | 15,455 | 226,879 | 116,716,292 |
| HOUSEHOLDS, HOUSEHOLD TYPE | ||||
| Family households: Map | 1,289 | 10,360 | 146,644 | 77,538,296 |
| Husband-wife family Map | 1,088 | 7,626 | 115,534 | 56,510,377 |
| Other family: Map | 201 | 2,734 | 31,110 | 21,027,919 |
| Male householder, no wife present Map | 73 | 853 | 10,993 | 5,777,570 |
| Female householder, no husband present Map | 128 | 1,881 | 20,117 | 15,250,349 |
| Nonfamily households: Map | 633 | 5,095 | 80,235 | 39,177,996 |
| Householder living alone Map | 537 | 4,169 | 63,480 | 31,204,909 |
| Householder not living alone Map | 96 | 926 | 16,755 | 7,973,087 |
| HOUSEHOLDS, HISPANIC OR LATINO ORIGIN OF HOUSEHOLDER | ||||
| Not Hispanic or Latino householder: Map | 1,874 | 14,848 | 211,903 | 103,254,926 |
| Hispanic or Latino householder: Map | 48 | 607 | 14,976 | 13,461,366 |
| HOUSEHOLDS, RACE OF HOUSEHOLDER | ||||
| Householder who is White alone | 1,824 | 12,739 | 211,365 | 89,754,352 |
| Householder who is Black or African American alone | 1 | 25 | 1,652 | 14,129,983 |
| Householder who is American Indian and Alaska Native alone | 58 | 2,195 | 3,833 | 939,707 |
| Householder who is Asian alone | 7 | 42 | 1,423 | 4,632,164 |
| Householder who is Native Hawaiian and Other Pacific Islander alone | 0 | 5 | 130 | 143,932 |
| Householder who is Some Other Race alone | 8 | 132 | 5,328 | 4,916,427 |
| Householder who is Two or More Races | 24 | 317 | 3,148 | 2,199,727 |
| HOUSEHOLDS, HOUSEHOLD TYPE BY HOUSEHOLD SIZE | ||||
| Family households: Map | 1,289 | 10,360 | 146,644 | 77,538,296 |
| 2-person household Map | 736 | 4,896 | 70,290 | 31,882,616 |
| 3-person household Map | 249 | 2,024 | 30,769 | 17,765,829 |
| 4-person household Map | 185 | 1,716 | 25,828 | 15,214,075 |
| 5-person household Map | 76 | 961 | 12,184 | 7,411,997 |
| 6-person household Map | 31 | 396 | 4,749 | 3,026,278 |
| 7-or-more-person household Map | 12 | 367 | 2,824 | 2,237,501 |
| Nonfamily households: Map | 633 | 5,095 | 80,235 | 39,177,996 |
| 1-person household Map | 537 | 4,169 | 63,480 | 31,204,909 |
| 2-person household Map | 85 | 776 | 13,278 | 6,360,012 |
| 3-person household Map | 7 | 98 | 2,274 | 992,156 |
| 4-person household Map | 1 | 26 | 826 | 411,171 |
| 5-person household Map | 3 | 15 | 260 | 126,634 |
| 6-person household Map | 0 | 8 | 76 | 48,421 |
| 7-or-more-person household Map | 0 | 3 | 41 | 34,693 |
| HOUSING UNITS | ||||
| Total Housing Units Map | 2,461 | 17,796 | 261,868 | 131,704,730 |
| HOUSING UNITS, OCCUPANCY STATUS | ||||
| Occupied Map | 1,922 | 15,455 | 226,879 | 116,716,292 |
| Vacant Map | 539 | 2,341 | 34,989 | 14,988,438 |
| HOUSING UNITS, OCCUPIED, TENURE | ||||
| Owned with a mortgage or a loan Map | 791 | 5,624 | 99,781 | 52,979,430 |
| Owned free and clear Map | 667 | 5,382 | 57,296 | 23,006,644 |
| Renter occupied Map | 464 | 4,449 | 69,802 | 40,730,218 |
| HOUSING UNITS, VACANT, VACANCY STATUS | ||||
| For rent Map | 32 | 371 | 7,304 | 4,137,567 |
| Rented, not occupied Map | 6 | 45 | 458 | 206,825 |
| For sale only Map | 17 | 170 | 3,376 | 1,896,796 |
| Sold, not occupied Map | 12 | 69 | 781 | 421,032 |
| For seasonal, recreational, or occasional use Map | 330 | 1,007 | 14,892 | 4,649,298 |
| For migrant workers Map | 3 | 3 | 322 | 24,161 |
| Other vacant Map | 139 | 676 | 7,856 | 3,652,759 |
| HOUSING UNITS, OCCUPIED, AVERAGE HOUSEHOLD SIZE BY TENURE | ||||
| Total: Map | 2.27 | 2.54 | 2.42 | 2.58 |
| Owner occupied Map | 2.33 | 2.54 | 2.50 | 2.65 |
| Renter occupied Map | 2.09 | 2.54 | 2.26 | 2.44 |
| HOUSING UNITS, OCCUPIED, TENURE BY RACE OF HOUSEHOLDER | ||||
| Owner occupied: Map | 1,458 | 11,006 | 157,077 | 75,986,074 |
| Householder who is White alone Map | 1,409 | 9,427 | 149,304 | 63,446,275 |
| Householder who is Black or African American alone Map | 0 | 10 | 630 | 6,261,464 |
| Householder who is American Indian and Alaska Native alone Map | 23 | 1,241 | 2,089 | 509,588 |
| Householder who is Asian alone Map | 4 | 29 | 696 | 2,688,861 |
| Householder who is Native Hawaiian and Other Pacific Islander alone Map | 0 | 1 | 55 | 61,911 |
| Householder who is Some Other Race alone Map | 5 | 88 | 2,620 | 1,975,817 |
| Householder who is Two or More Races Map | 17 | 210 | 1,683 | 1,042,158 |
| Renter occupied: Map | 464 | 4,449 | 69,802 | 40,730,218 |
| Householder who is White alone Map | 415 | 3,312 | 62,061 | 26,308,077 |
| Householder who is Black or African American alone Map | 1 | 15 | 1,022 | 7,868,519 |
| Householder who is American Indian and Alaska Native alone Map | 35 | 954 | 1,744 | 430,119 |
| Householder who is Asian alone Map | 3 | 13 | 727 | 1,943,303 |
| Householder who is Native Hawaiian and Other Pacific Islander alone Map | 0 | 4 | 75 | 82,021 |
| Householder who is Some Other Race alone Map | 3 | 44 | 2,708 | 2,940,610 |
| Householder who is Two or More Races Map | 7 | 107 | 1,465 | 1,157,569 |
| HOUSING UNITS, OCCUPIED, TENURE BY HISPANIC OR LATINO ORIGIN OF HOUSEHOLDER | ||||
| Owner occupied: Map | 1,458 | 11,006 | 157,077 | 75,986,074 |
| Not Hispanic or Latino householder Map | 1,429 | 10,636 | 149,066 | 69,617,625 |
| Hispanic or Latino householder Map | 29 | 370 | 8,011 | 6,368,449 |
| Renter occupied: Map | 464 | 4,449 | 69,802 | 40,730,218 |
| Not Hispanic or Latino householder Map | 445 | 4,212 | 62,837 | 33,637,301 |
| Hispanic or Latino householder Map | 19 | 237 | 6,965 | 7,092,917 |
| HOUSING UNITS, OCCUPIED, TENURE BY HOUSEHOLD SIZE | ||||
| Owner occupied: Map | 1,458 | 11,006 | 157,077 | 75,986,074 |
| 1-person household Map | 323 | 2,517 | 35,544 | 16,453,569 |
| 2-person household Map | 696 | 4,583 | 64,793 | 27,618,605 |
| 3-person household Map | 203 | 1,514 | 23,053 | 12,517,563 |
| 4-person household Map | 152 | 1,253 | 19,377 | 10,998,793 |
| 5-person household Map | 51 | 644 | 8,829 | 5,057,765 |
| 6-person household Map | 27 | 265 | 3,473 | 1,965,796 |
| 7-or-more-person household Map | 6 | 230 | 2,008 | 1,373,983 |
| Renter occupied: Map | 464 | 4,449 | 69,802 | 40,730,218 |
| 1-person household Map | 214 | 1,652 | 27,936 | 14,751,340 |
| 2-person household Map | 125 | 1,089 | 18,775 | 10,624,023 |
| 3-person household Map | 53 | 608 | 9,990 | 6,240,422 |
| 4-person household Map | 34 | 489 | 7,277 | 4,626,453 |
| 5-person household Map | 28 | 332 | 3,615 | 2,480,866 |
| 6-person household Map | 4 | 139 | 1,352 | 1,108,903 |
| 7-or-more-person household Map | 6 | 140 | 857 | 898,211 |
Loading...